RStudio can plot nice networks and graphs. By graph, I mean here the mathematical artifact: \(G = (V,E)\). I.e. a collection of nodes and arcs.
DiagrammeR is an R package that includes graphviz. RStudio has some support for graphviz input files (editing, drawing). Basically we need to specify nodes and arcs, and let the tool do its work.
I like it.
DiagrammeR is an R package that includes graphviz. RStudio has some support for graphviz input files (editing, drawing). Basically we need to specify nodes and arcs, and let the tool do its work.
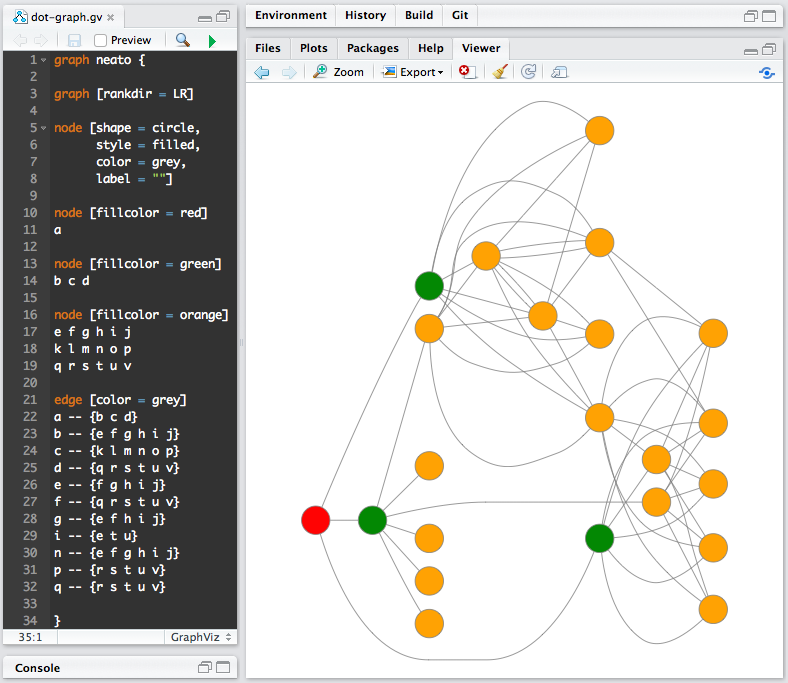 |
| Graphviz file in RStudio (picture from [1]) |
I like it.
References
- DiagrammeR Docs, graphviz, http://rich-iannone.github.io/DiagrammeR/graphviz_and_mermaid.html
- Graphviz, Node, Edge and Graph attributes, https://graphviz.gitlab.io/_pages/doc/info/attrs.html